We will set up a privacy-compliant by-design data project with you in this tutorial. Every data project is a multidisciplinary team collaboration. Our platform will help you to take an active approach to reduce your company’s risks in applicable data and privacy regulations, while focusing on the value the project can bring.
The project we are going to setup is an example of a local government that wants to use different data sources for sustainable development and local government policy changes. The data project will specifically focus on wheelchair accessibility in our region.
Let’s start with the tutorial.
1. Login
First, you are asked to log in to the datastreams platform
2. Go to our company
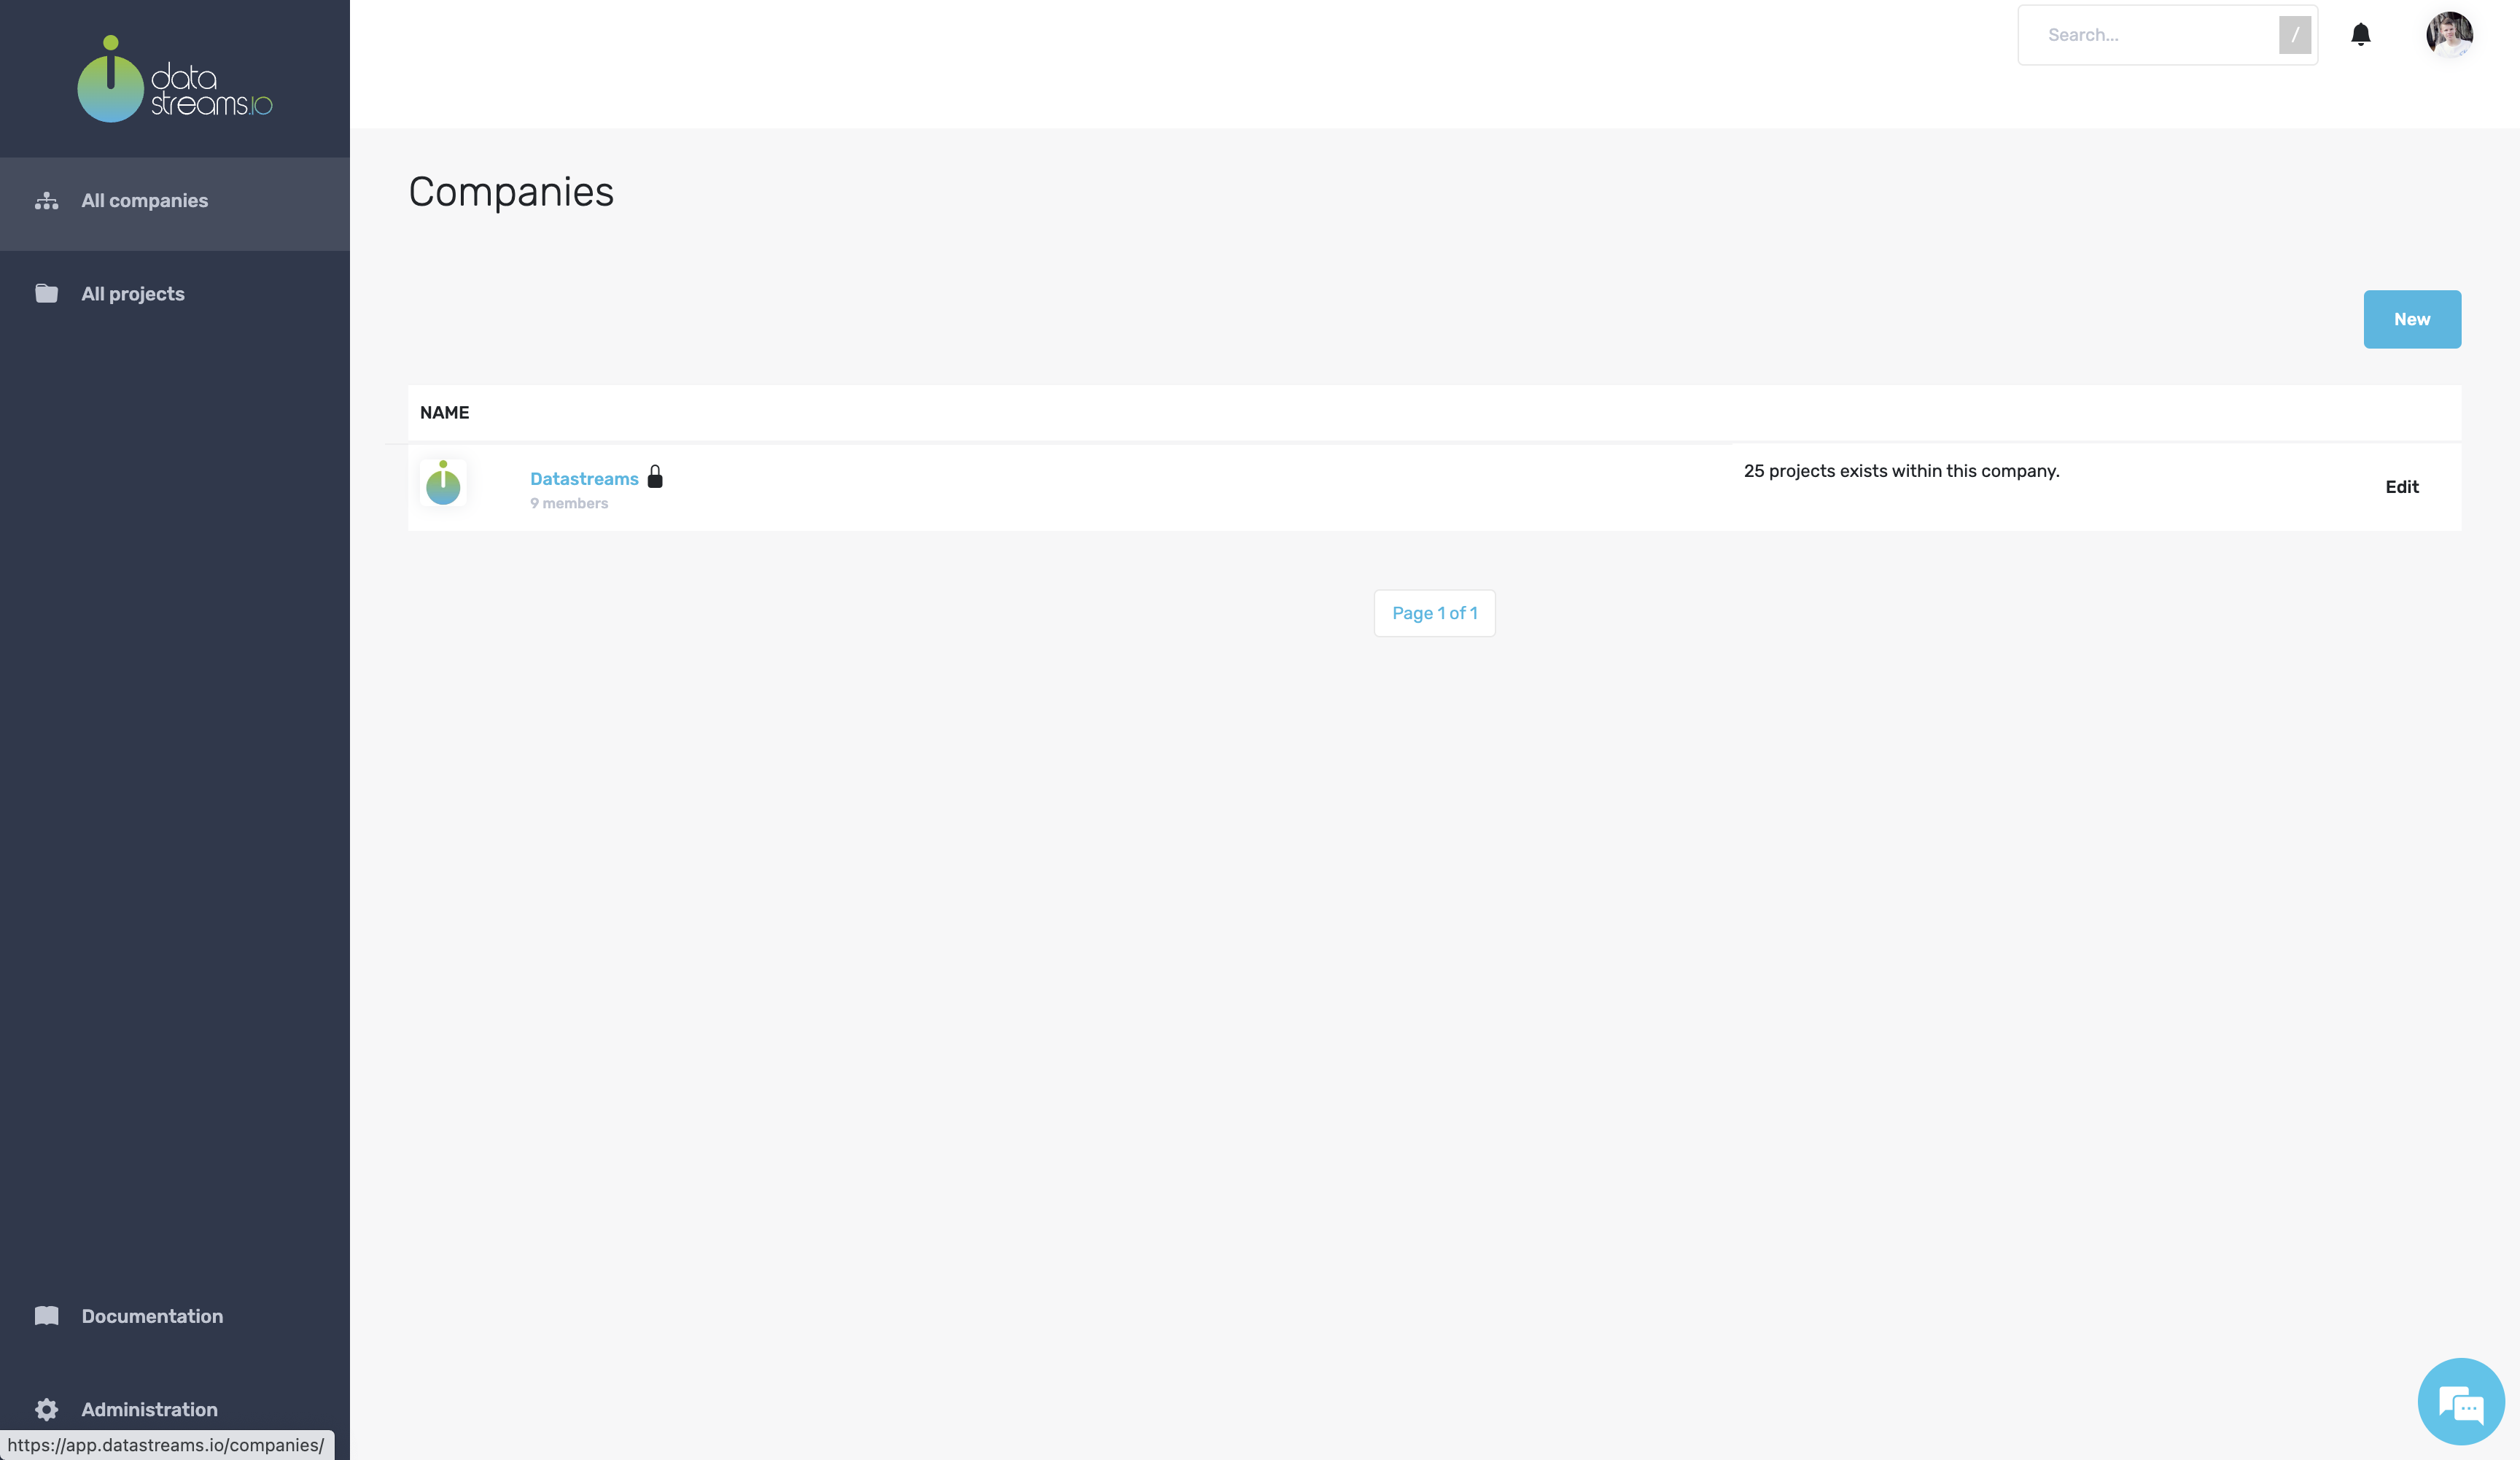
Click on all companies in the left navigation bar. Then click on your company.
3. Create a new project
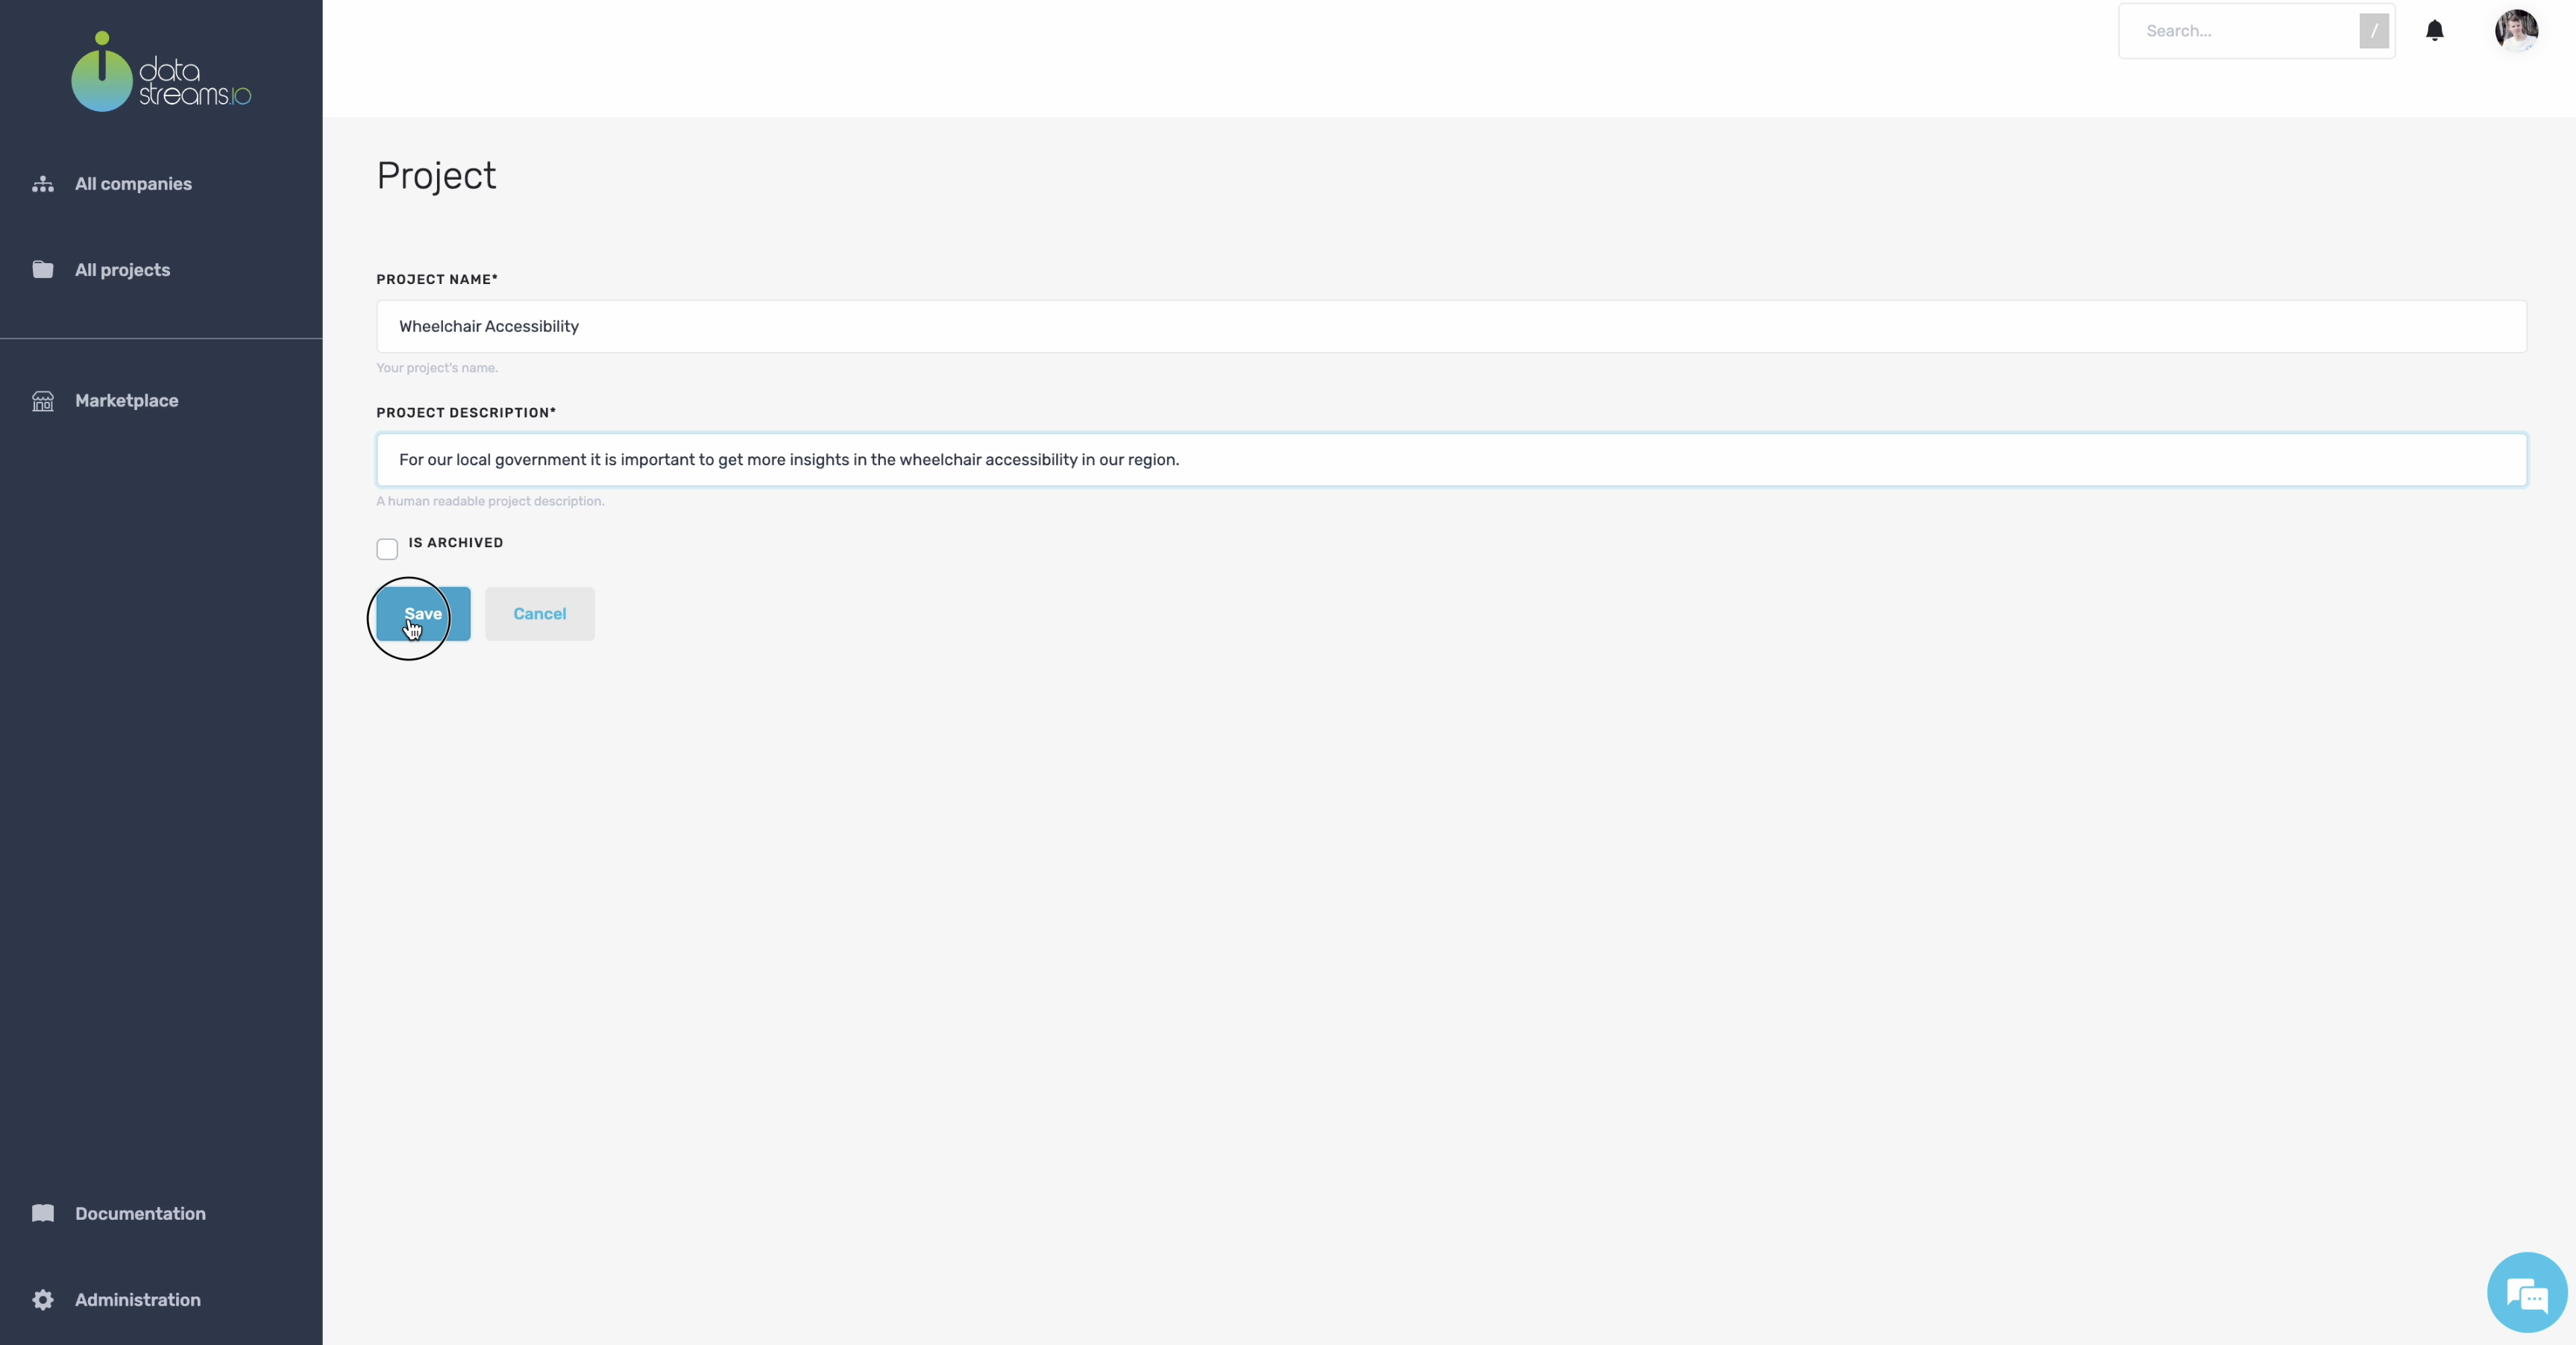
You can create a project to manage everything we will use to determine how wheelchair accessible our region is.
Give your project a title and a description.
4. Project data canvas
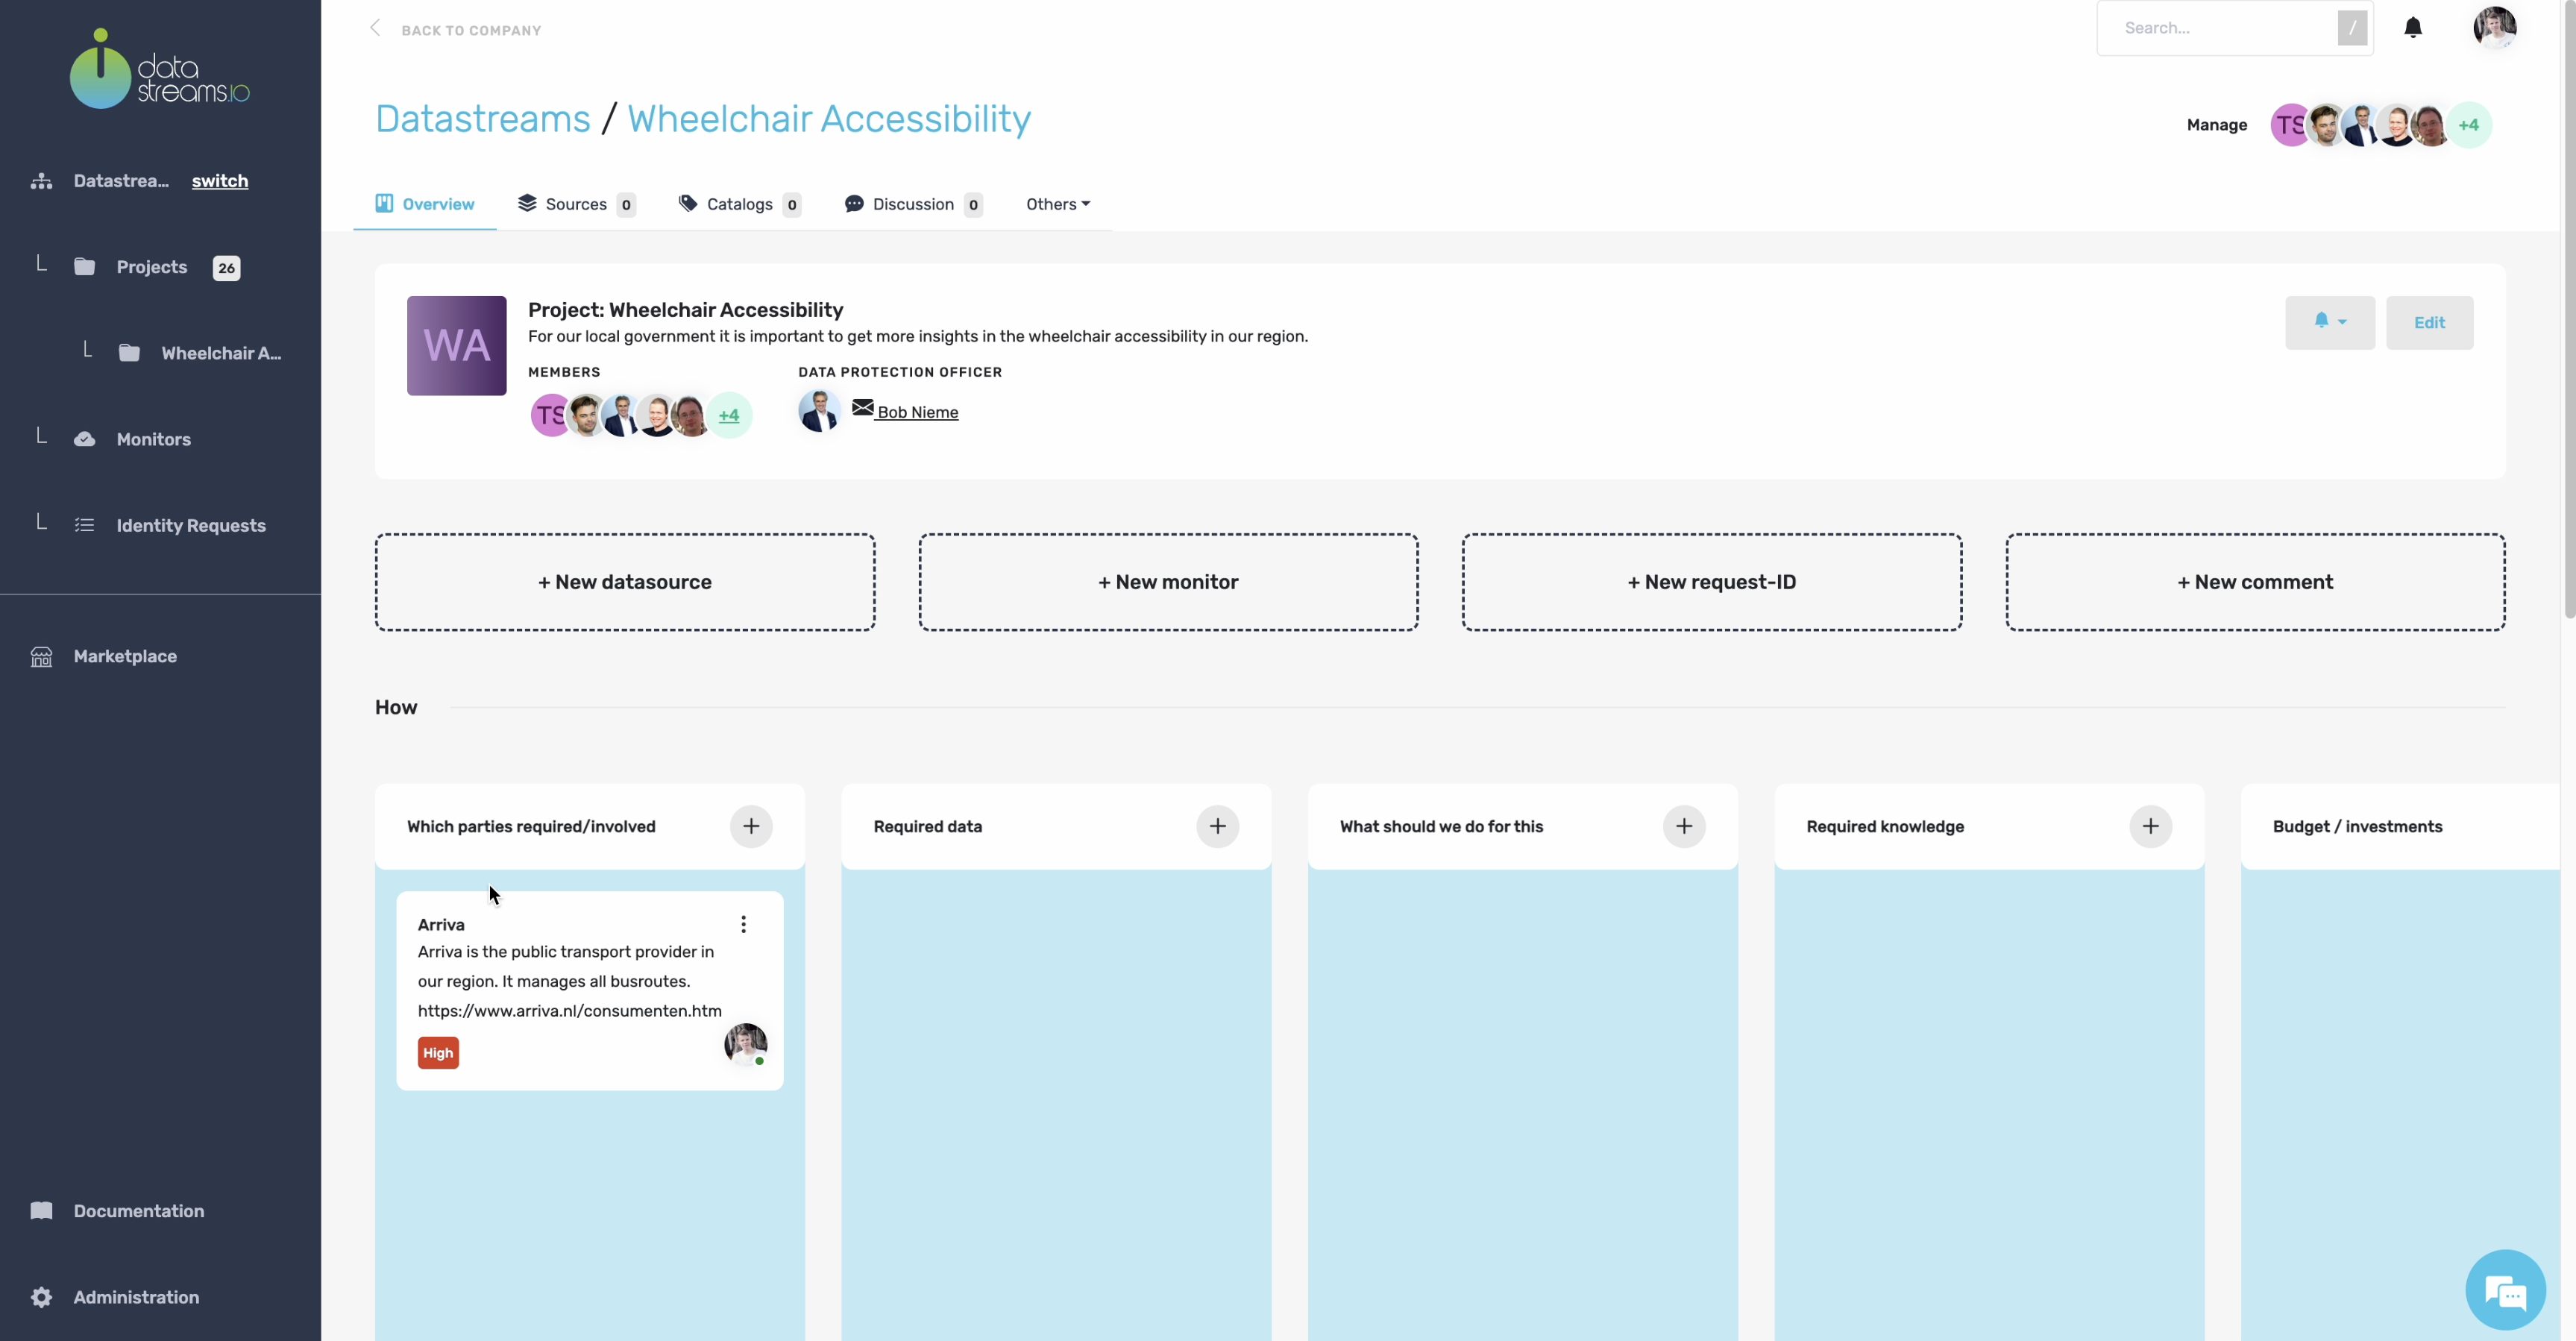
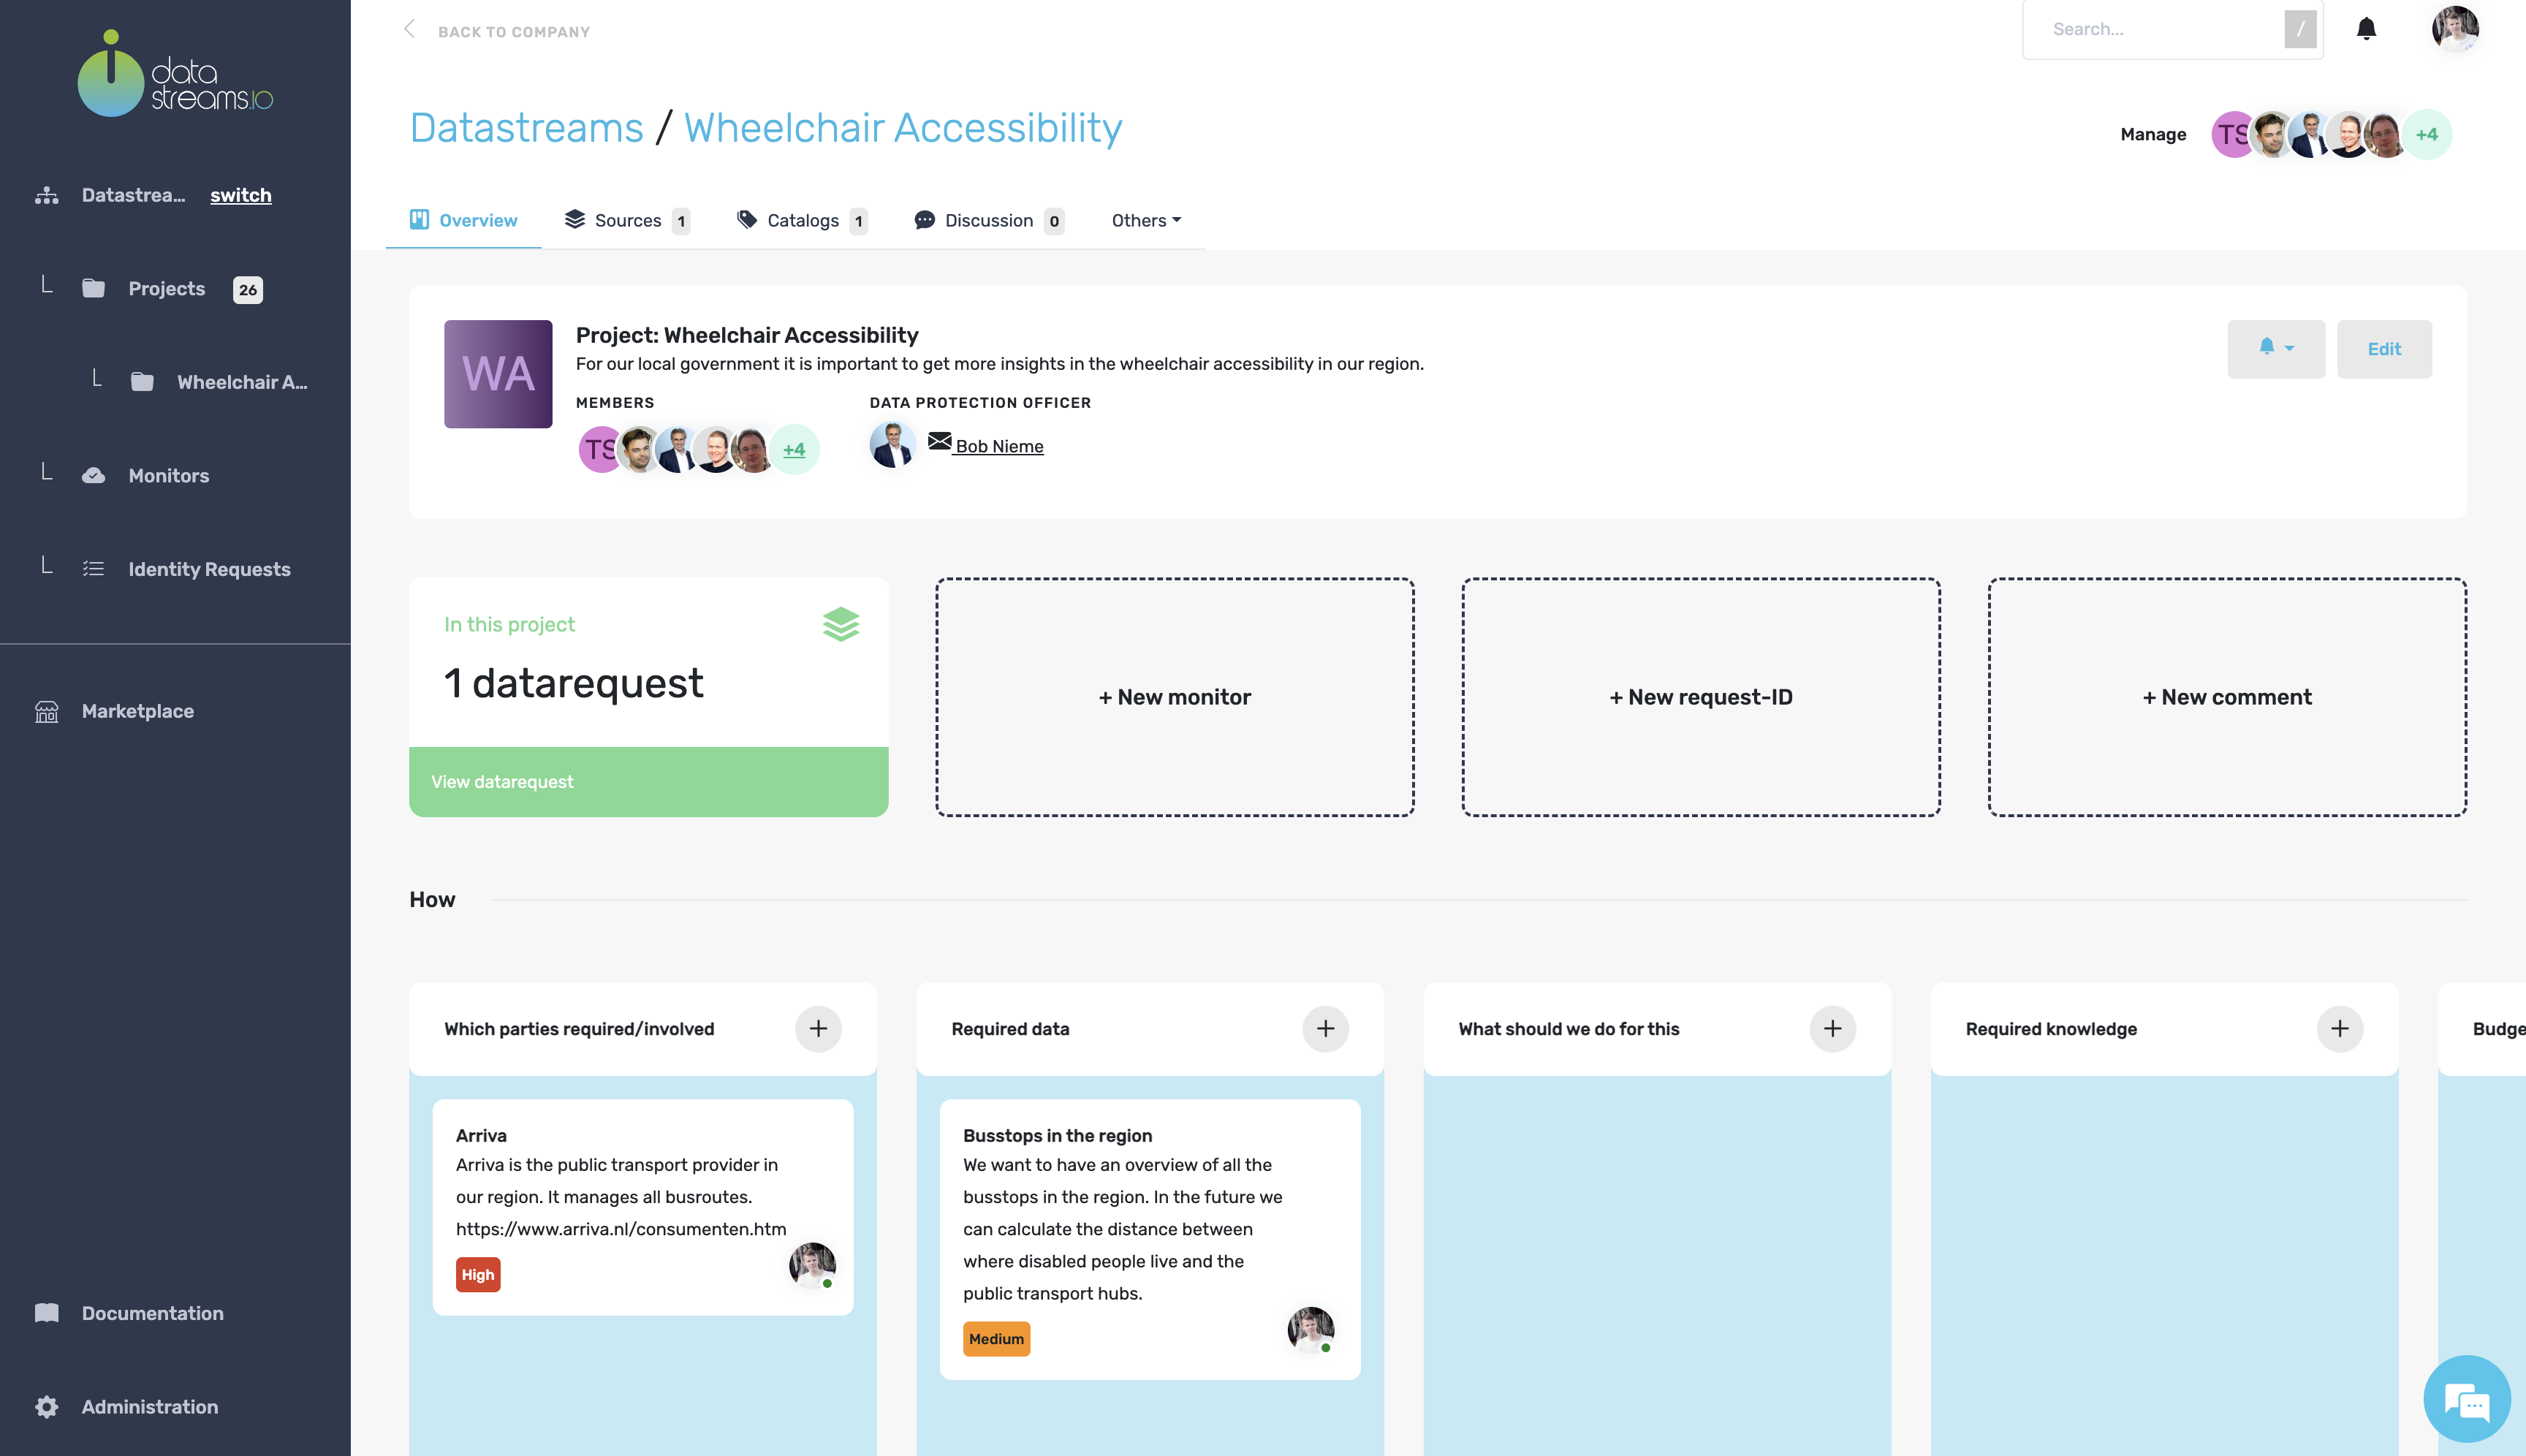
After creating the project, you see the project overview, a title, a description, and the members that have access to this project. In addition, you can see that we subscribed to notifications of this project.
Scrolling down, you will have the project’s data canvas. The data canvas helps us think about our data project’s ‘why’, ‘what’, and ‘how’. The data canvas also allows you to pay attention to the fact that data projects are multidisciplinary, so you can actively manage the collaboration between technology and organization in this canvas. A must-have for successful data-driven collaboration!
5. Adding notes
First, you are asked to log in to the datastreams platform
6. Data canvas overview
For our wheelchair accessibility project, we have several parties that are involved.
An essential partner in our project is Arriva, which manages all public transport in our region. So, let’s add this partner to our canvas.
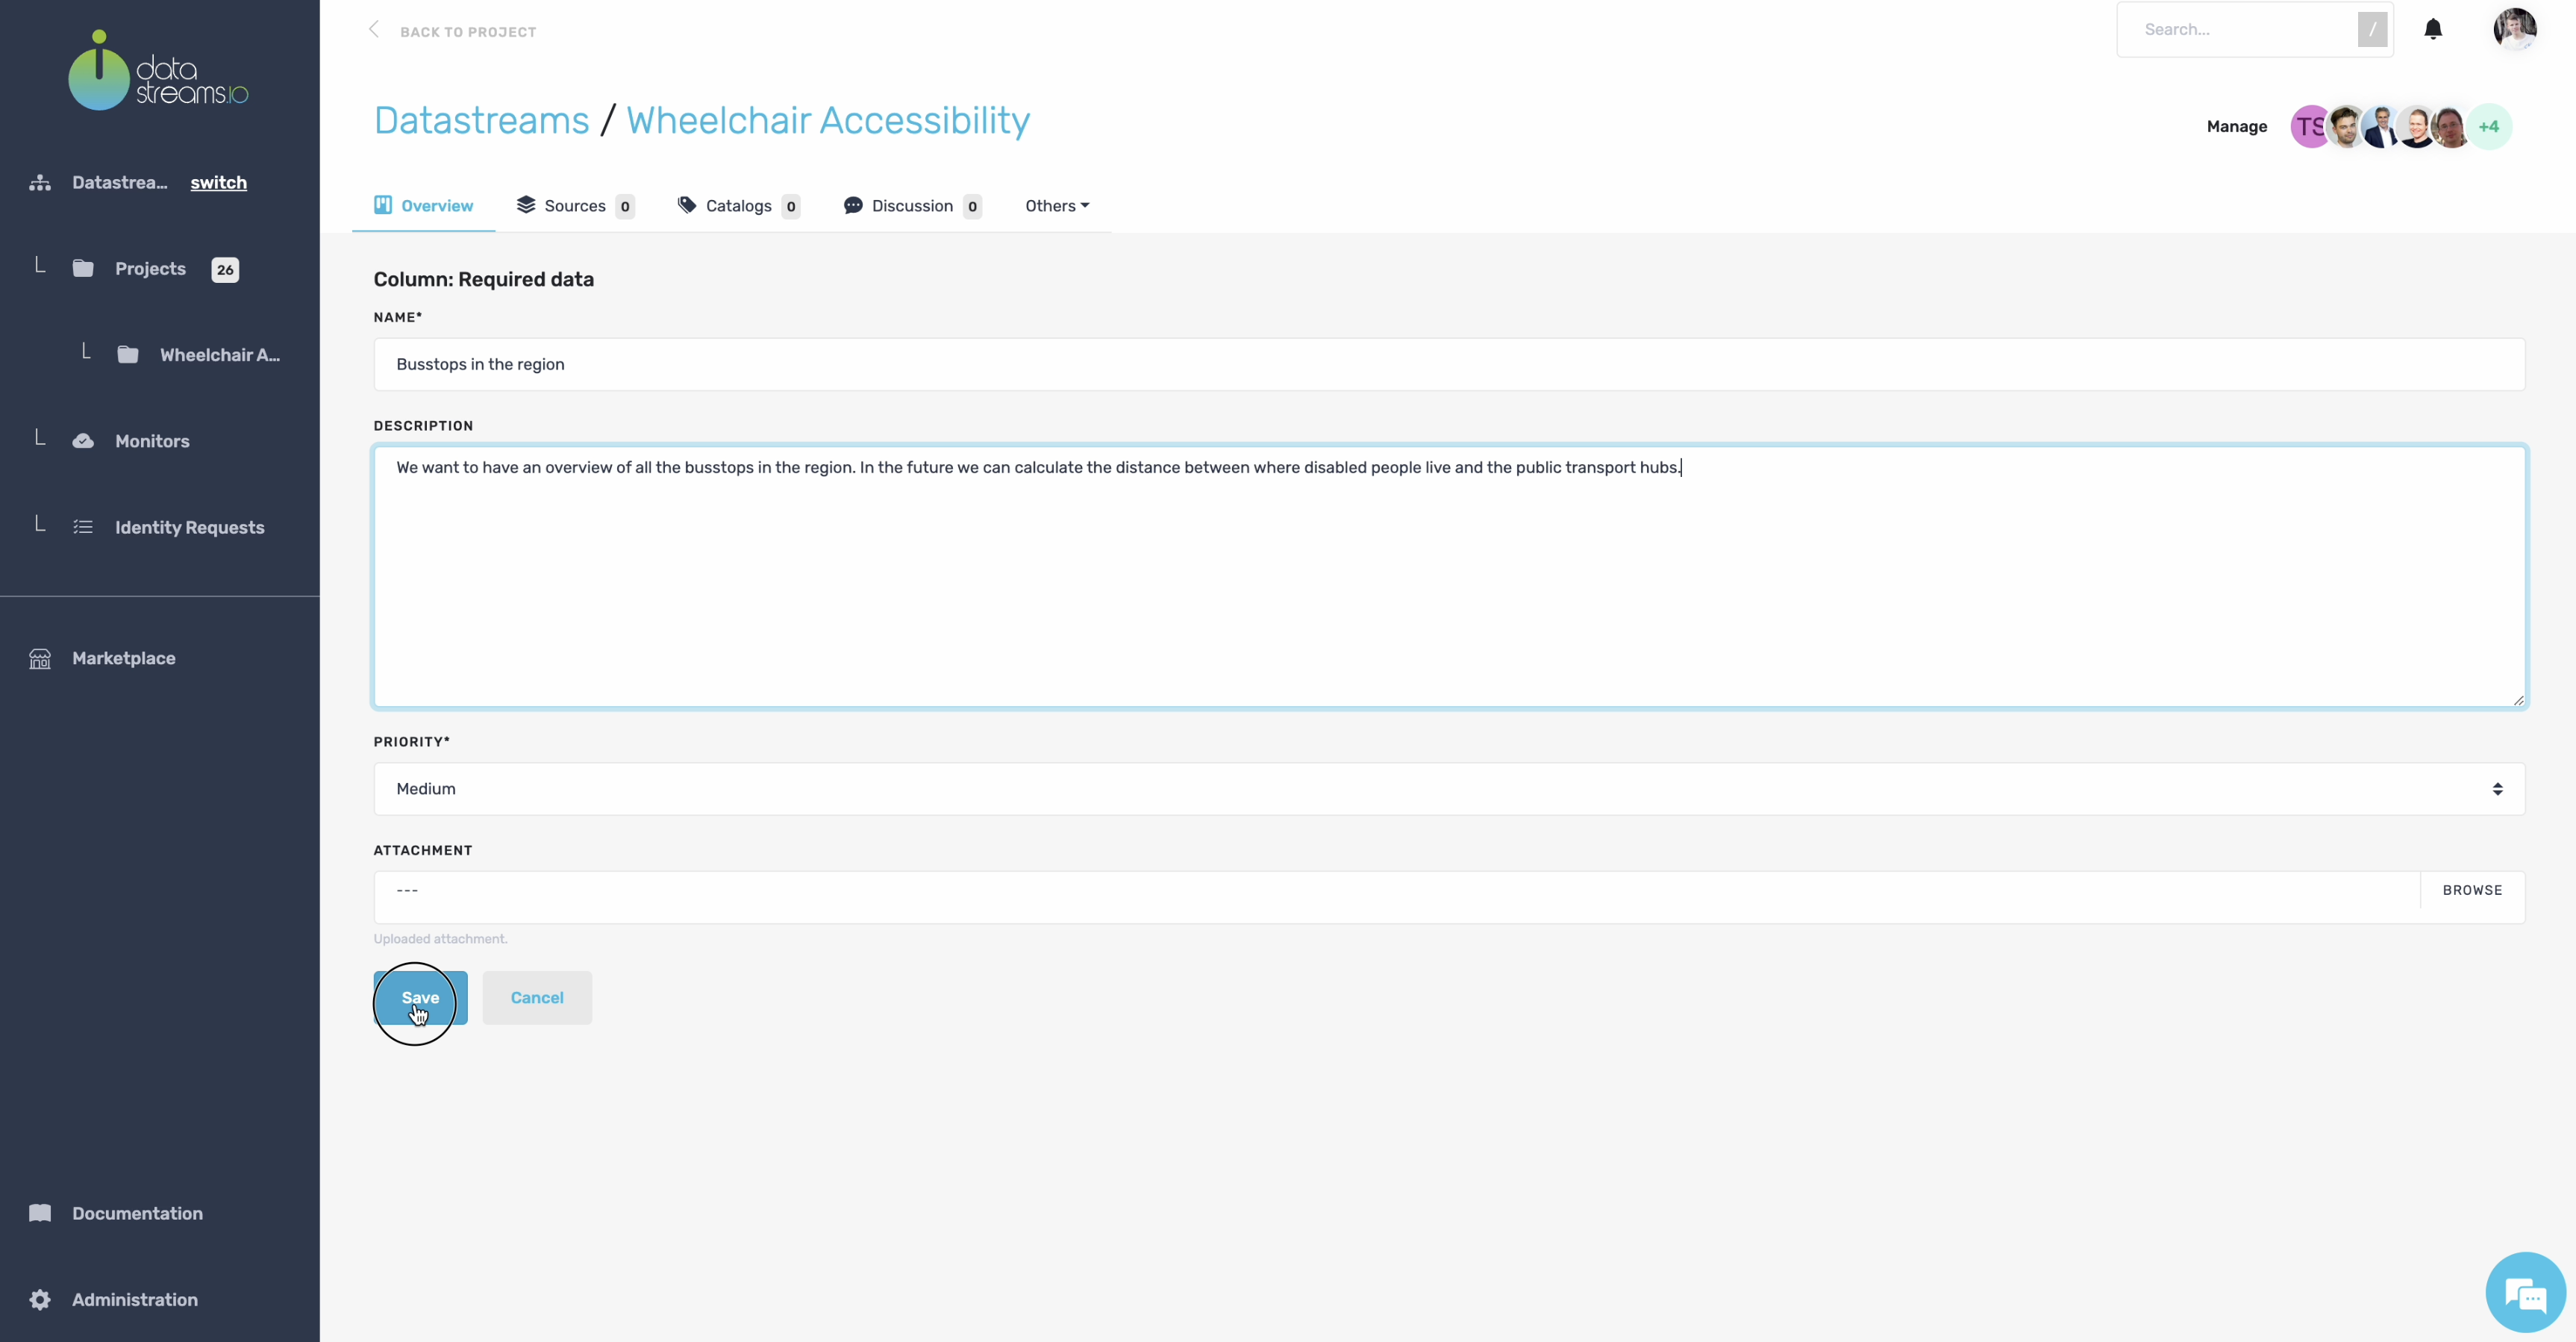
Arriva manages a dataset with all bus stops in our region. We can use this dataset to analyze whether there are sufficient wheelchair stops near disabled centers. So, let’s also add this to the canvas.

7. Add data sources
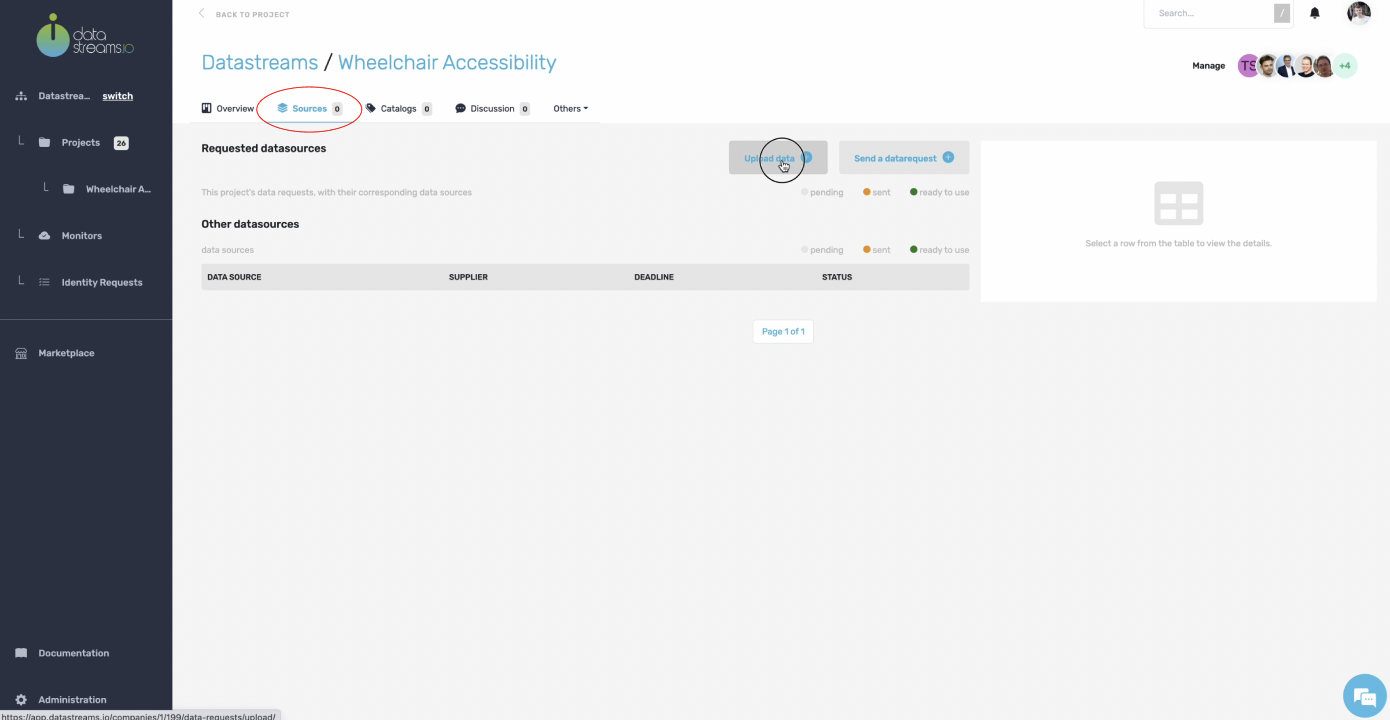
After you setup your canvas, you can start adding data sources to your project. Click on plus to add a new data source. You are now in the sources tab within our project. Here you see an overview of all data sources added to your project. Currently, there are no data sources, as we have just started.
On our local PC we have a CSV file which contains all bus stops in our region. As described in the canvas, this data source is helpful in this project. We can add the data to our project by clicking the upload data button. Our CSV has some variables that could be privacy intrusive, but we will manage these privacy risks in a few moments.
8. Upload data
Let’s upload our CSV file.
To keep track of your data sources and understand your projects, you describe the data you will upload.
Previous
Next
9. Data sources
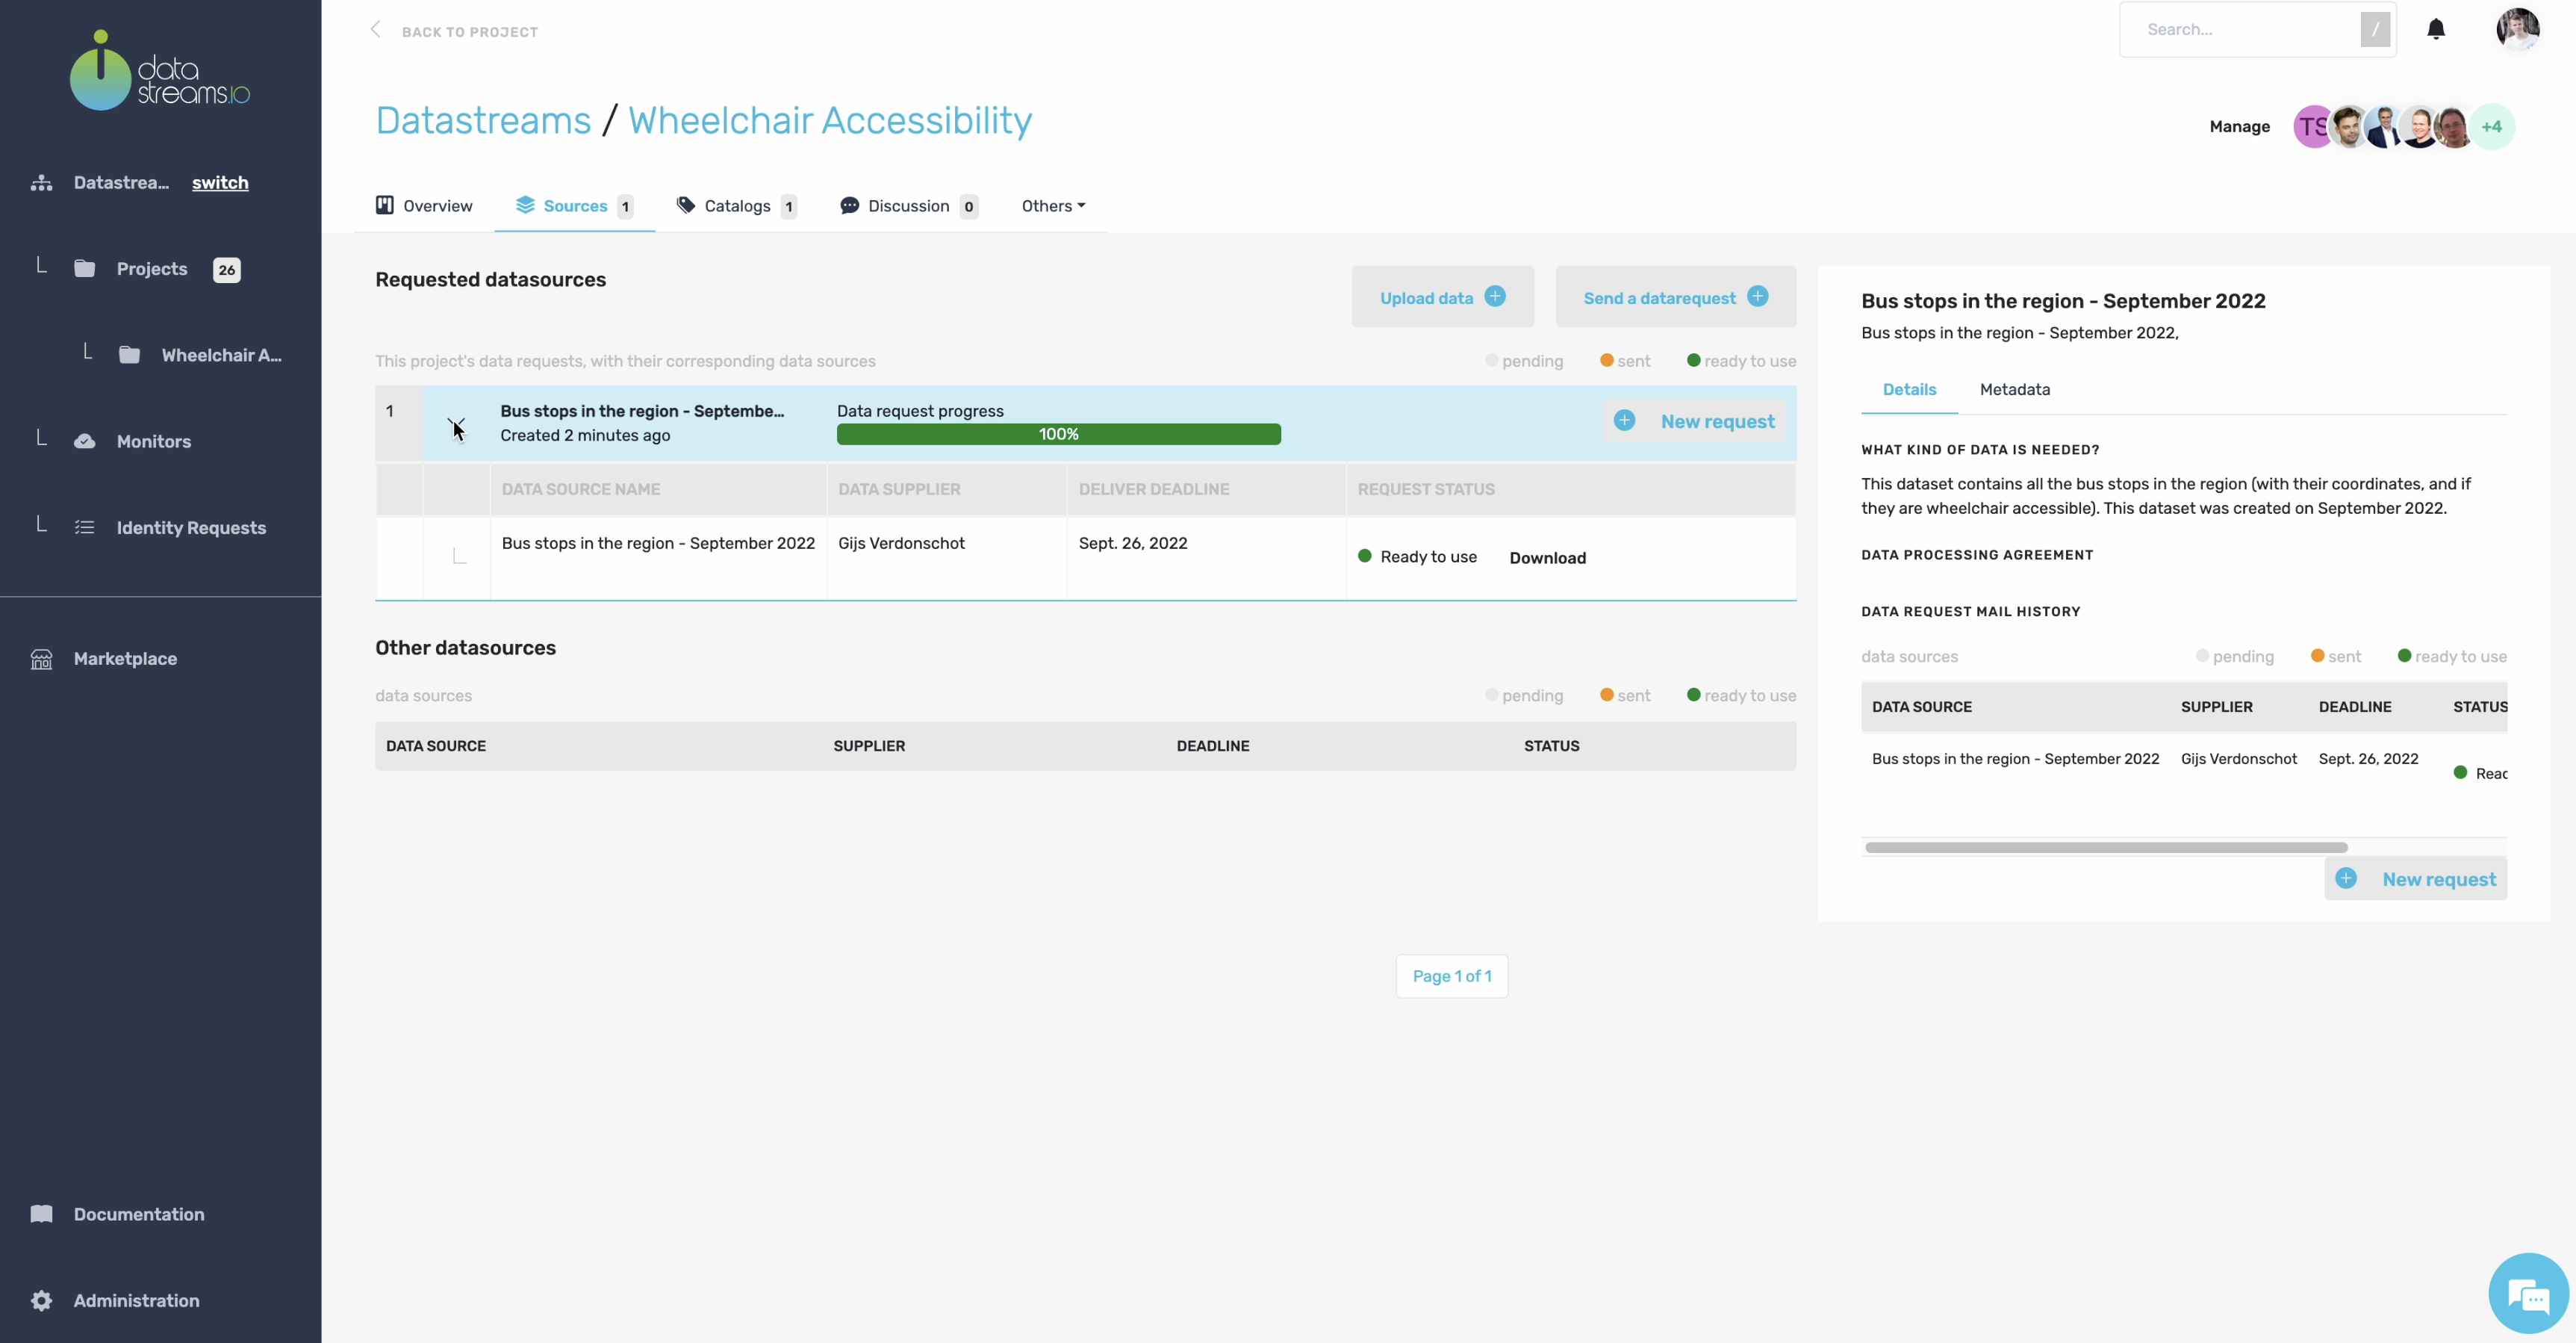
After uploading the data, we see a new data source in the overview, which is 100% completed. This is as easy as it gets!
10. Data catalogs
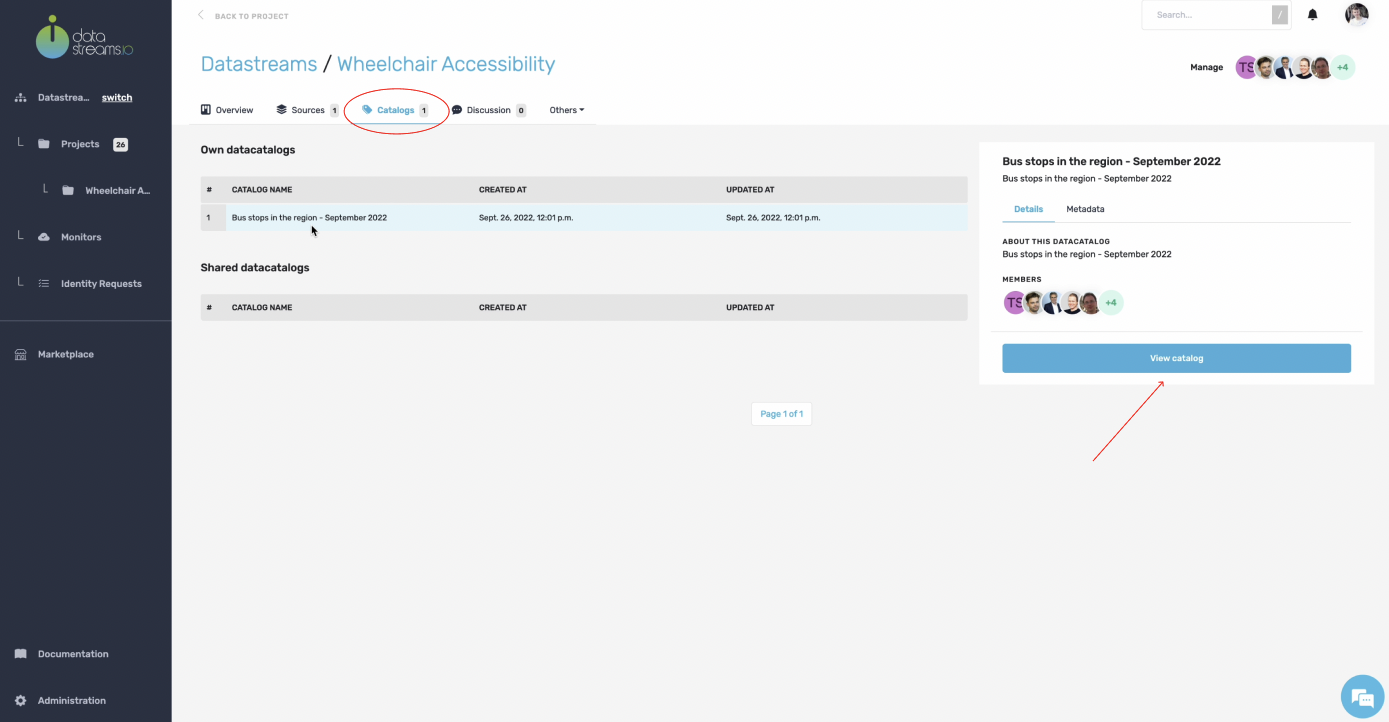
Data sources in your project will transform automatically into data catalogs. A data catalog is an overview of the data in your data source without showing you all the details.
Let’s investigate the automatically created data catalog.
11. Data catalog overview
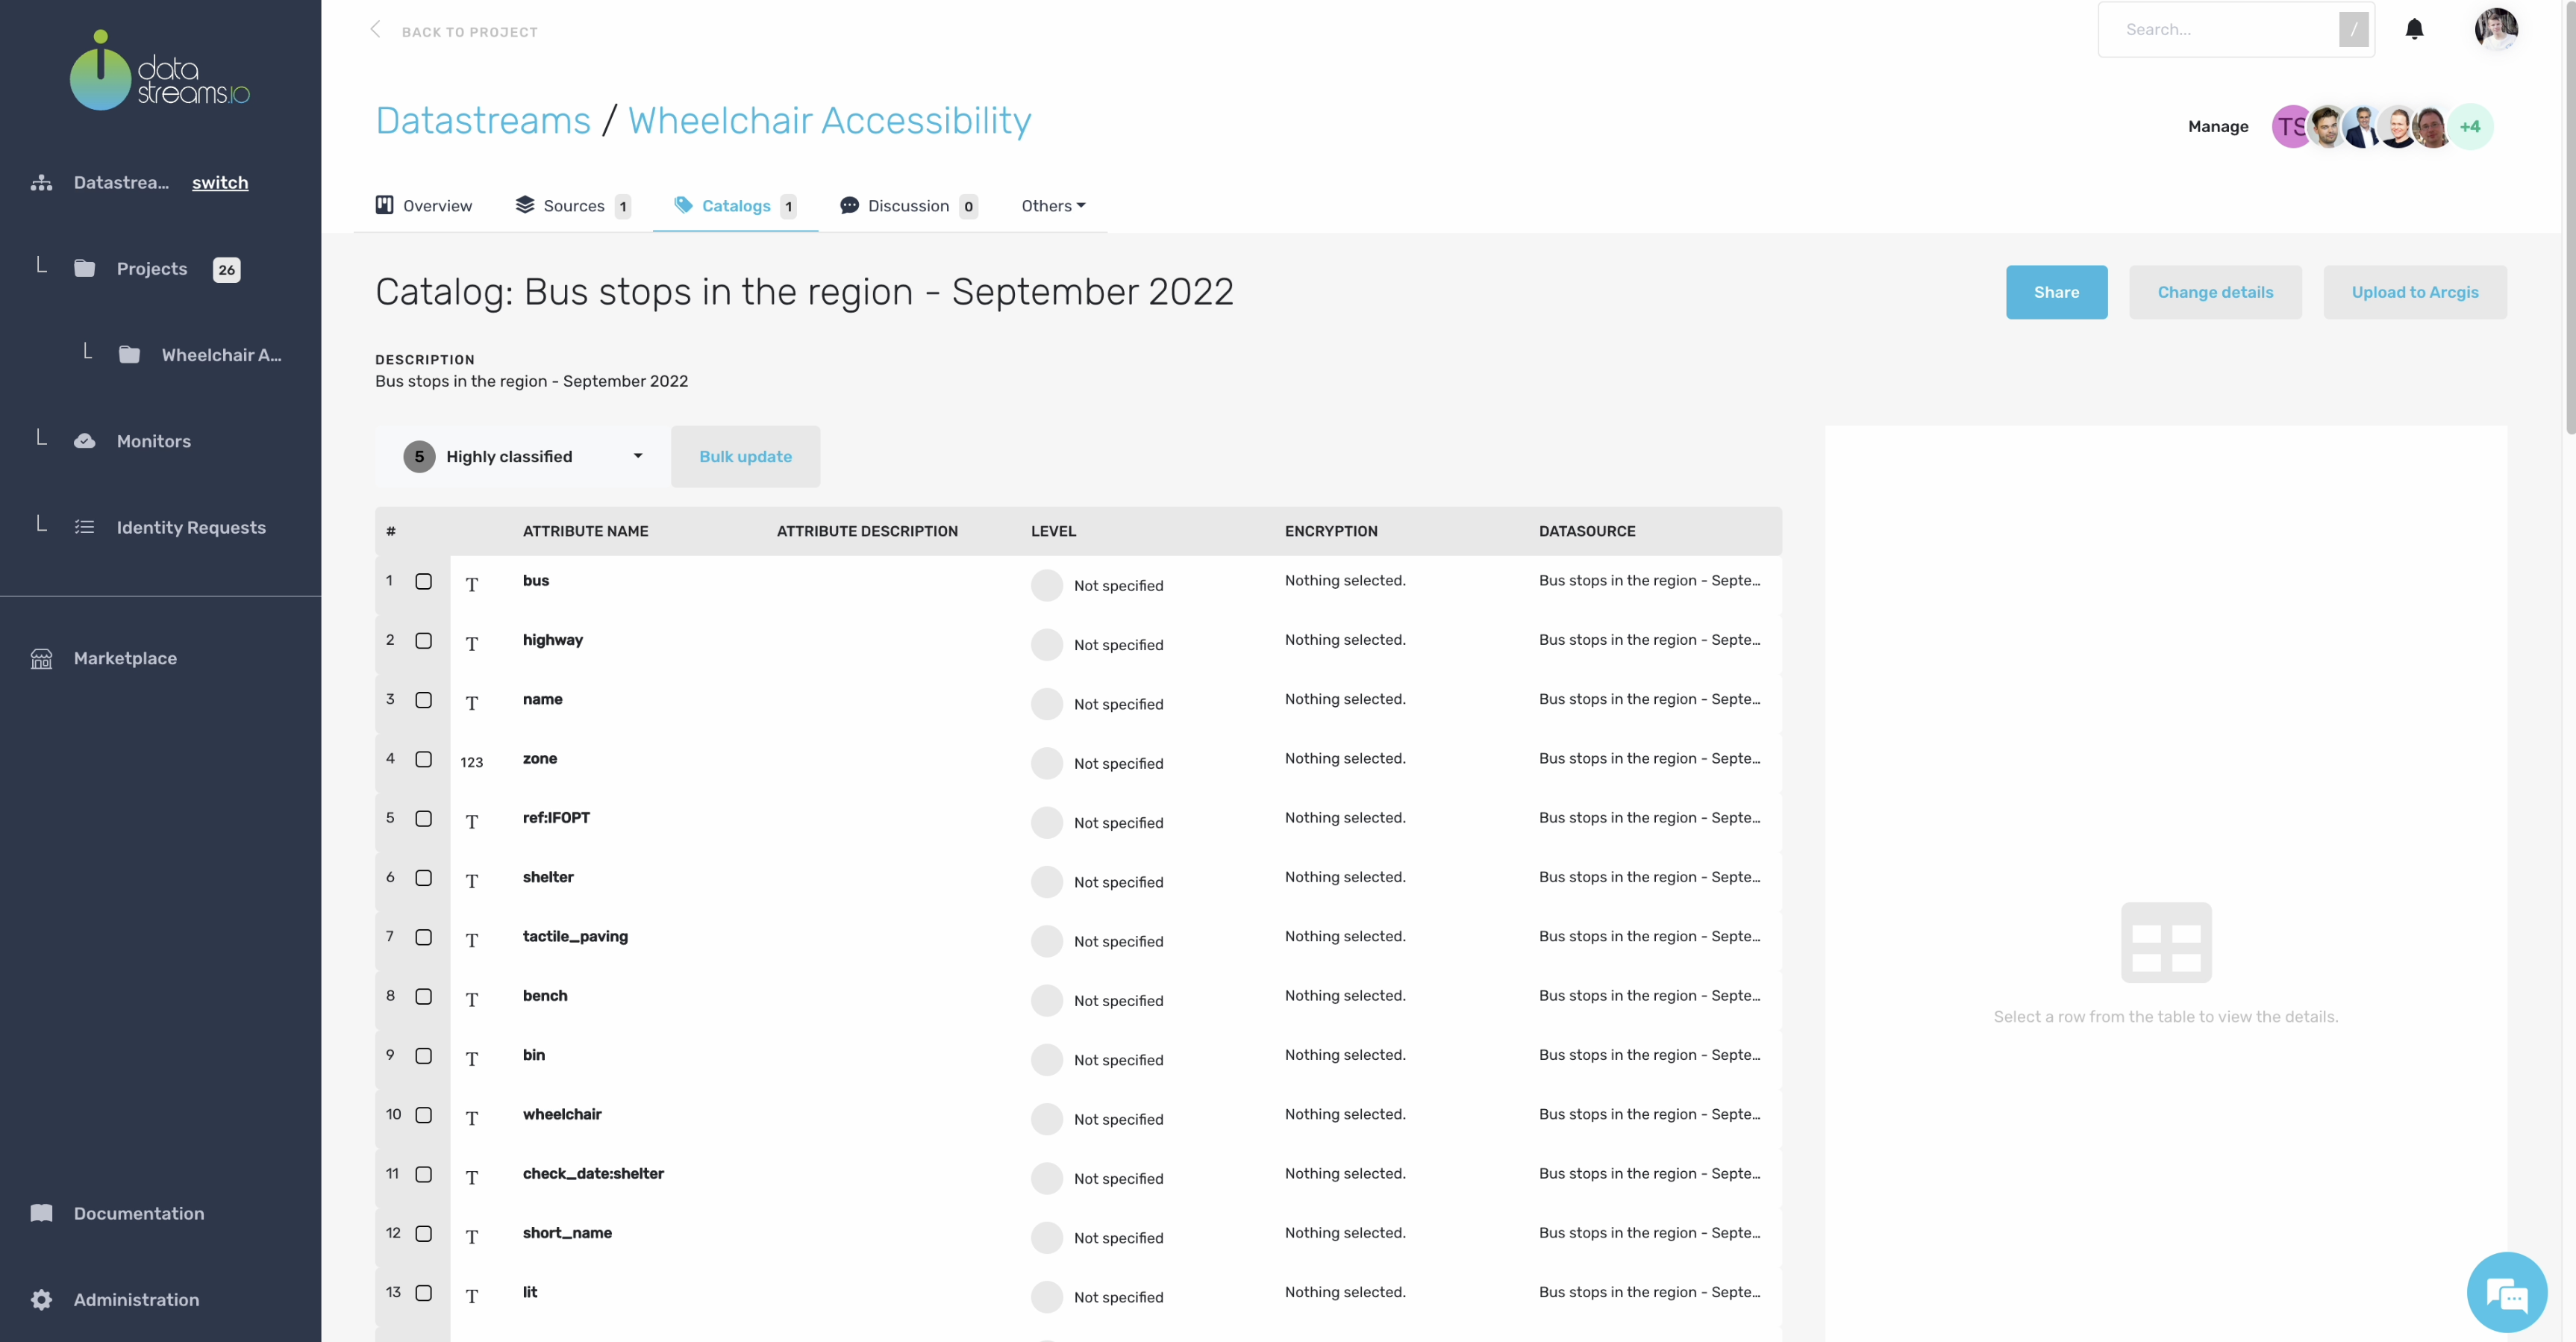
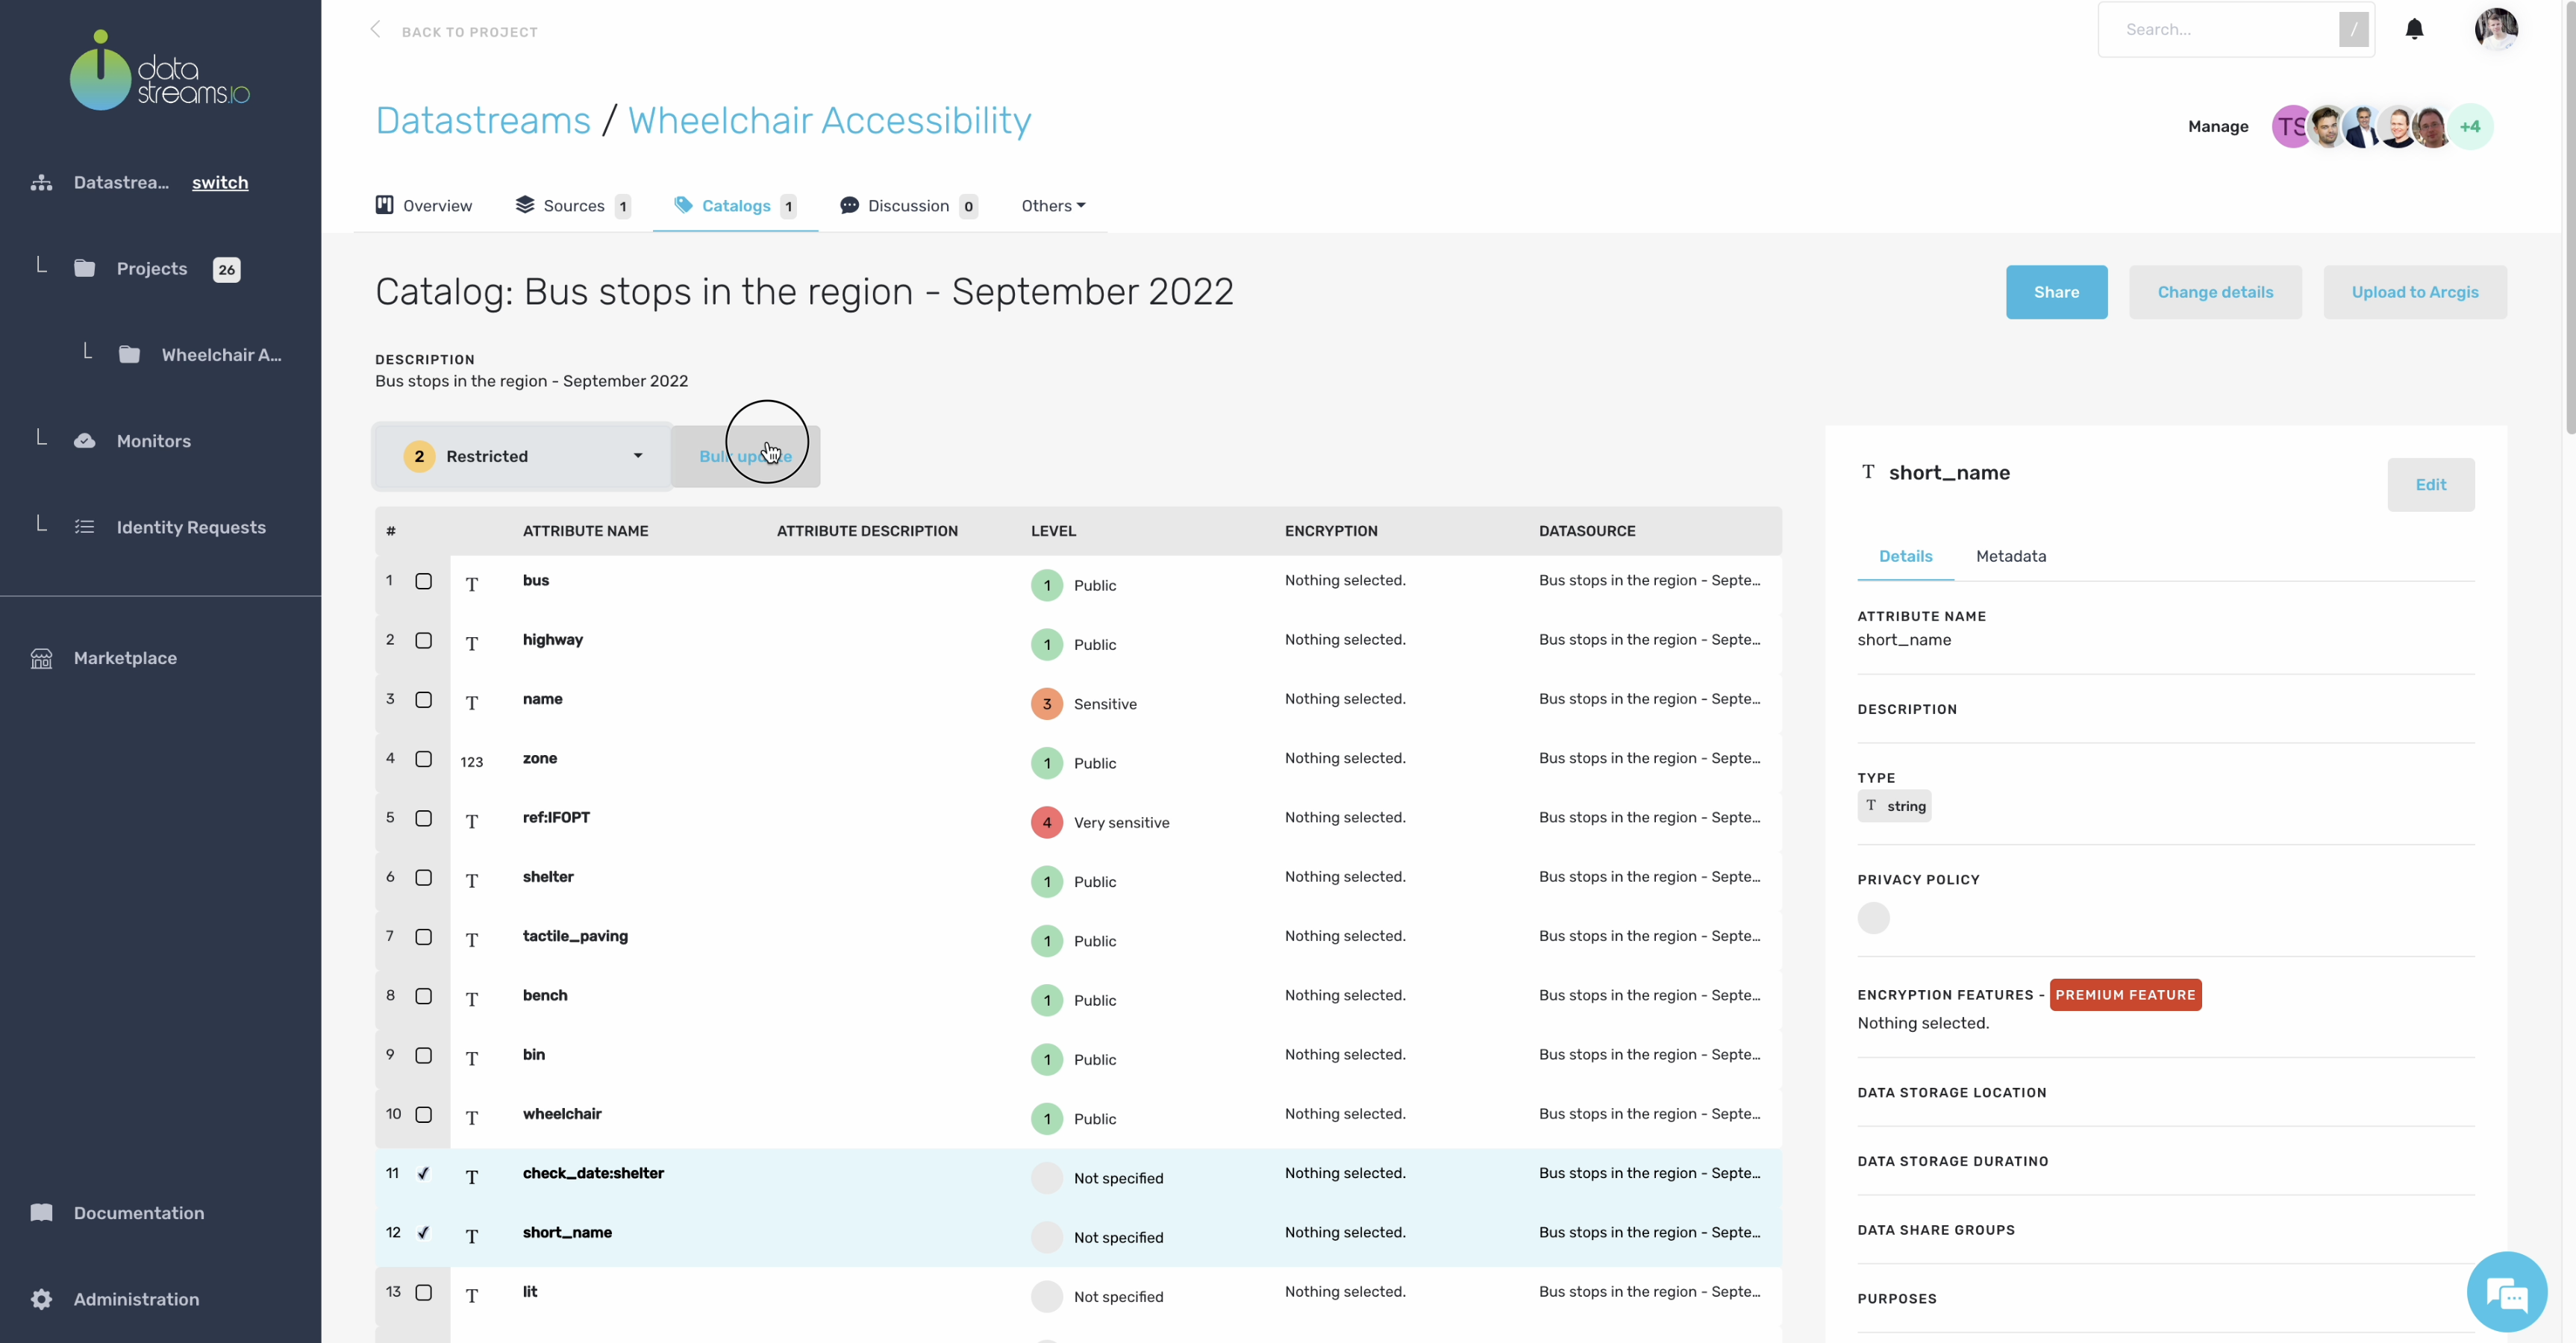
You now see an overview of the data catalog, which describes the bus stop data source we just uploaded. In addition, you can see all the columns that are also present in our data source CSV file.
As described earlier in your data canvas, for the bus stops dataset, we need to visualize if there are sufficient wheelchair stops available where there is the need. So nearby where citizens live, that have deficiencies due to their mobility. However, our bus stop dataset contains some privacy-sensitive data that we don’t want to show in the visualization. So we can add different privacy compliance levels to your catalog to prevent the improper use of sensitive data.
Let’s tag all the data attributes in our catalog.
12. Tagging data attributes
Now you have tagged your catalog with the correct privacy-compliance levels. You can use these levels to restrict privacy-sensitive data from sending to third-party vendors such as visualization engines.
13. Connect to Arcgis
An example of a third-party vendor which is enabled in our project is Arcgis. Arcgis is a visualization environment which is often used by local governments. We are also going to use this third-party visualization tool for our project visualizations.
Click on upload to Arcgis. A popup shows your settings to enable the visualization. In your privacy selection field, you can set which privacy-compliance levels are applicable for Arcgis. For example, if you put this to level 2 restricted, only level 1 and level 2 data will be sent to Arcgis. Higher levels will be excluded and not sent at all.
In this example we set our privacy selection to level 1.

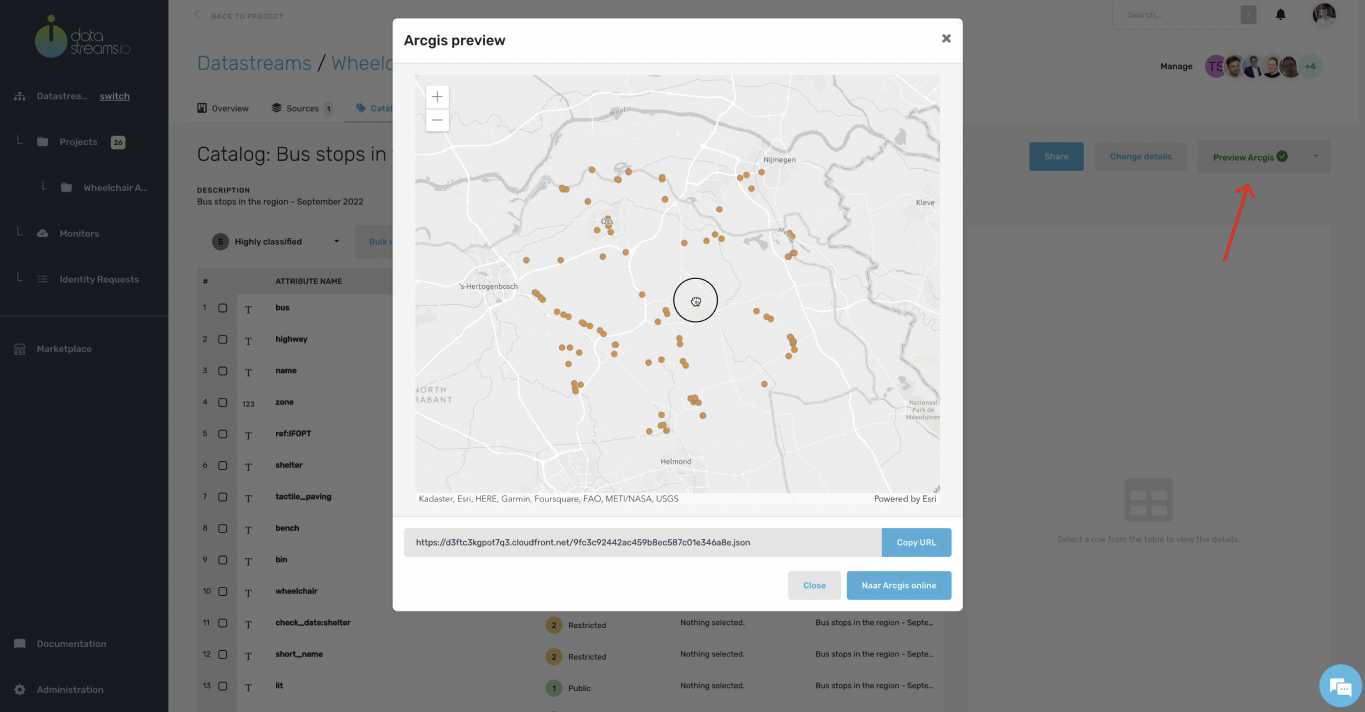
14. Preview Arcgis upload
After uploading the data, you see a preview of your visualization. The data link imports the data into other tools, for example, in the Arcgis Web viewer. Your project is assured and secured with your company and or project policies. Only level 1 data is available for the Arcgis Web viewer for those users who can have access.
15. Import in Arcgis
After importing the data link in the Arcgis Web viewer, you see that only level 1 data is available in this third-party tool. Higher levels are not sent at all, so no risk when there are data breaches at this third-party tool.


 Feel free to contact me, and I will be more than happy to answer all of your questions.